In late 2012 I reached out to Ed and the team at Inbound.org and asked if I could put together a statistical analysis of the Inbound.org community’s first year.
I wanted to look at a number of basic things like:
- most prolific websites in our community (aside from SEOMoz.org, that is)
- how people were interacting with Inbound.org in general
- how user interaction had changed over the course of the year (submission velocity, vote velocity, & comment velocity)
- most popular categories of content on inbound
- average upvotes by time of day, day of the week
- most common voting and submission times
I also wanted to take a look at some more obscure stats:
- what percentage of domains were www subdomain vs. naked subdomain vs. custom subdomain
- what percentage of articles submitted contained code for Authorship (and which kind), Twitter cards, and Facebook Open Graph.
- a keyword cloud of article titles (imagine: it’s like an actual industry thought cloud for 2012)
Thankfully they said yes, and what you see here is the result of way too many January & February nights, but I think it produced some interesting insights into the inbound.org community and what we shared and talked about in 2012.
A couple notes before we dig into the data:
Credit Where Credit Is Due
Many thanks to Ed Fry & the inbound team for providing the data necessary to calculate everything here. (Don’t worry, they didn’t give me any of your personal information). I could have scraped the site and gotten some of the data, but it wouldn’t have been nearly as in-depth as what’s below.
Please Feel Free to Share & Reuse Image Files
All of the image files and charts below are free to be used by anyone and released under CC by 3.0 US. Attribution back to this page and Inbound.org are encouraged but not necessary.
Requests for Custom Statistics
There’s a lot of cool statistics I probably haven’t thought of. Tell me in the comments what statistics you’d like to see calculated and I’ll publish them (so long as they’re approved by the inbound.org team).
Comments & Disclaimer on Calculations & Methodology
All of the data was given to me in the form of a SQL database. I recreated the database, exported each SQL table to CSV, imported into Excel, and pulled into pivot tables where I could filter and manipulate. I considered using fancier software like Tableau that can connect to MySQL and perform calculations on multiple tables, but after spending 3 hours with it I realized it was way beyond my needs (not to mention abilities) for this project, so in the end I used Excel for all numbers shown on this page.
Because the data I worked with was exported after 12:01am on Jan 1, there are some slight variations on some of the statistics. For example, if I calculated total number of votes based upon the articles database table for all articles submitted in 2012, and then compared that to the votes database table that lays out each specific vote submitted in 2012, the numbers will be slightly different since I wasn’t able to perfectly adjust the articles table to only include votes in 2012. As another example, 6% of votes didn’t have a timestamp attached, so graphs like “upvotes by time of day” and “upvotes by day” are technically completed with ~95% of data available. I don’t know if the missing data is distributed evenly throughout the population or not. So, we’ll have to live with it.
Despite that I think the data is still representative of the year in aggregate. I’m not a data scientist, all I can say is that I double checked my calculations each time and did my best to not change any of the fields except where necessary. Maybe next year I’ll hire a statistician to verify my calculations. Then again, maybe I’ll just hire them to do the whole darn thing.
Bird’s Eye Statistics
User Activity:
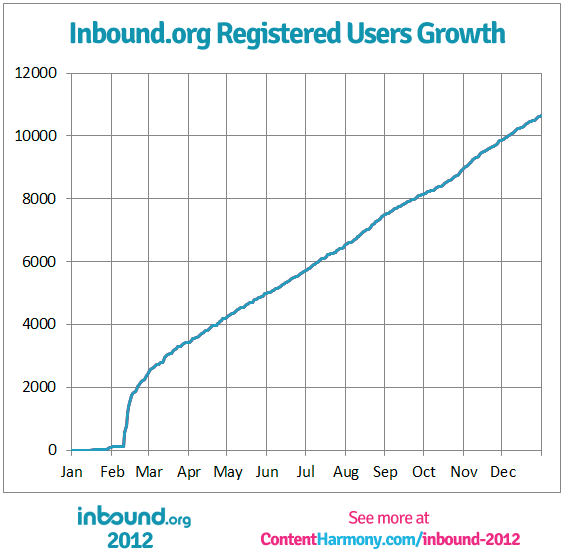
In 2012, there were 10,653 registered users
- 5474 registered users upvoted articles that they didn’t submit (51.4% of registered users)
- 3019 registered users upvoted more than 1 article that they didn’t submit (28.3% of registered users)
- 2546 registered users submitted articles, tools, or discussions (23.9% of registered users)
- 1508 registered users submitted content that got more than 1 vote (14.1% of registered users)
- 1534 registered users left comments (14.4% of registered users)
- 219 user accounts needed to be banned (2.1% of registered users)
Article Submission Activity:
23,256 articles submitted from 4,803 domains with 82,397 votes and 9,016 comments
- Average of 3.54 upvotes and 0.39 comments per article
- 12,160 of articles received more than one upvote (52.3% of articles submitted)
- 3,737 of articles had comments (30.7% of articles that had more than one upvote)
Tool Submission Activity:
406 tools submitted with 1496 upvotes and 152 comments
- Average of 3.7 upvotes and 0.4 comments per tool
- 225 tools received more than one upvote (55% of tools)
- 78 tools had comments (19% of tools)
Top Domains
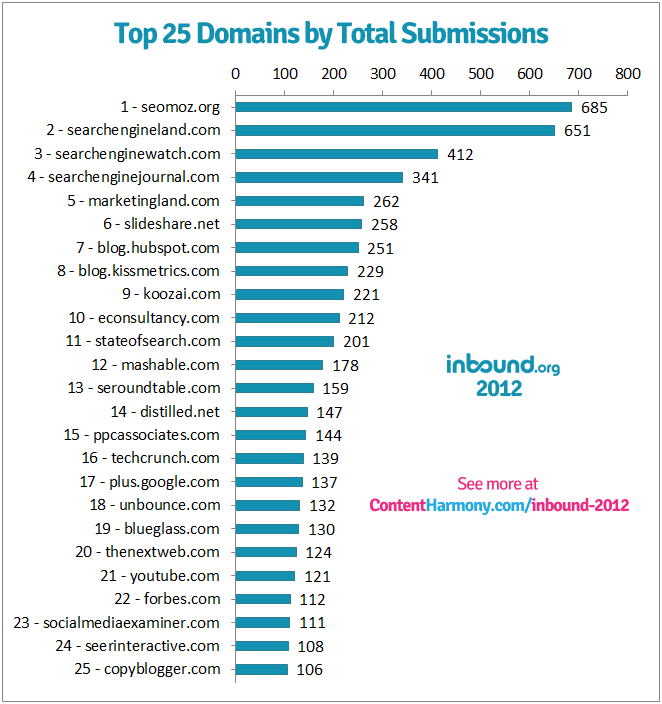
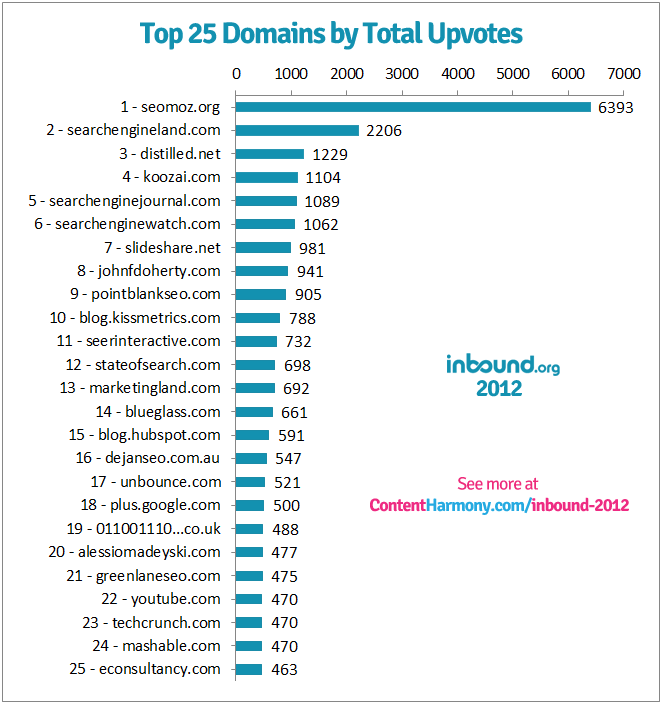
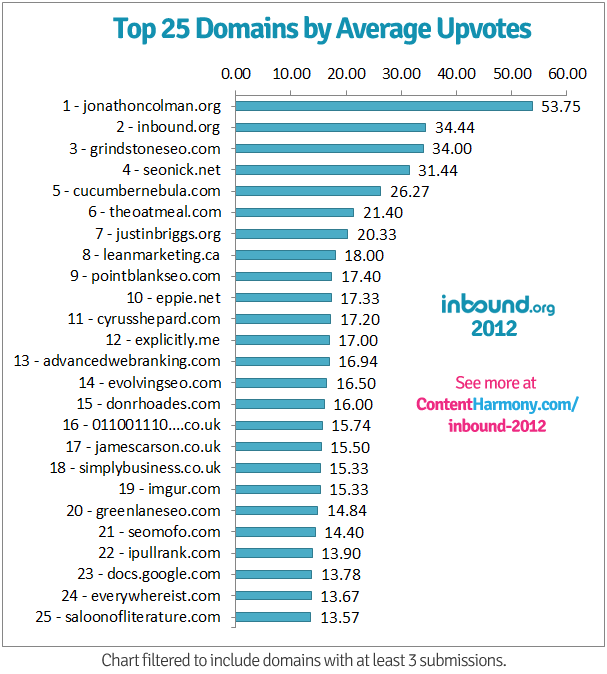
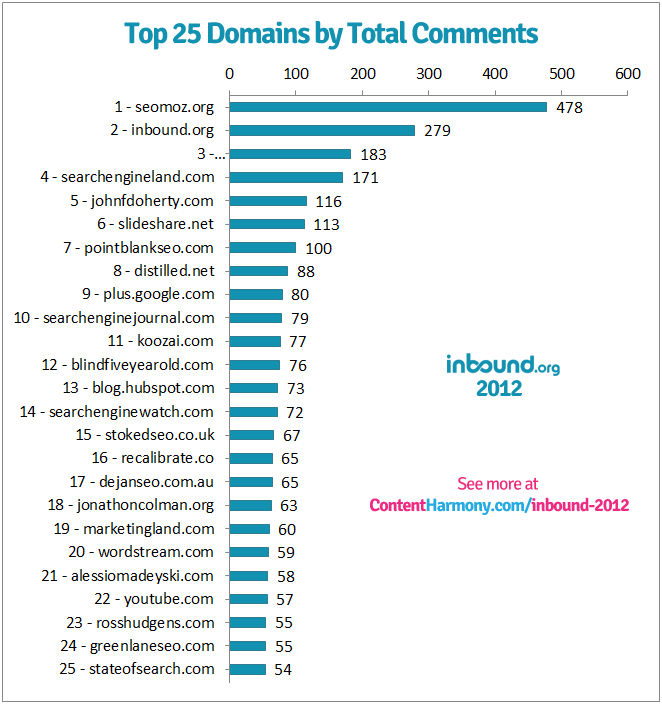
Top 25 domains were calculated by total submissions, total upvotes, average upvotes, total comments, and average comments. These statistics removed flagged URLs as well as URLs for tool submissions.
Top 25 Domains by Total Submissions
Top 25 Domains by Total Upvotes
Top 25 Domains by Average Upvotes
This data was filtered to only include domains with at least 3 submissions. This was to remove the “one hit wonders” that had excellent posts, but only or two in total.
Top 25 Domains by Total Comments
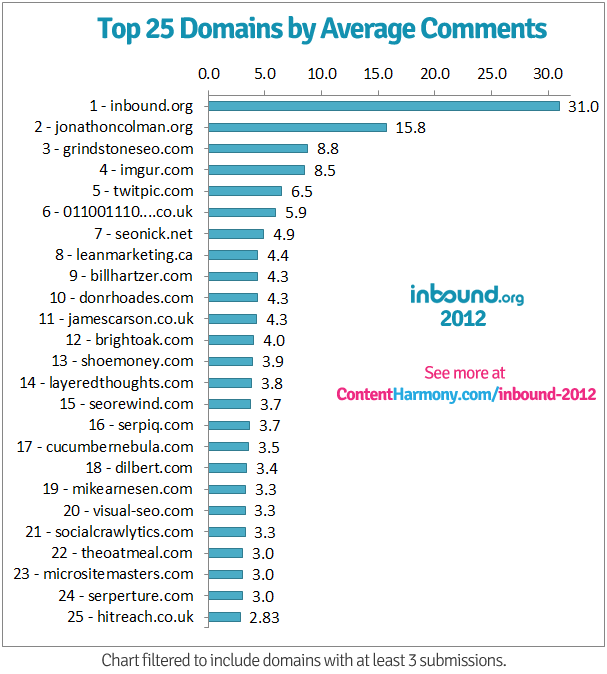
Top 25 Domains by Average Comments
This data was filtered to only include domains with at least 3 submissions. This was to remove the “one hit wonders” that had highly-discussed posts, but only or two in total.
Category Statistics
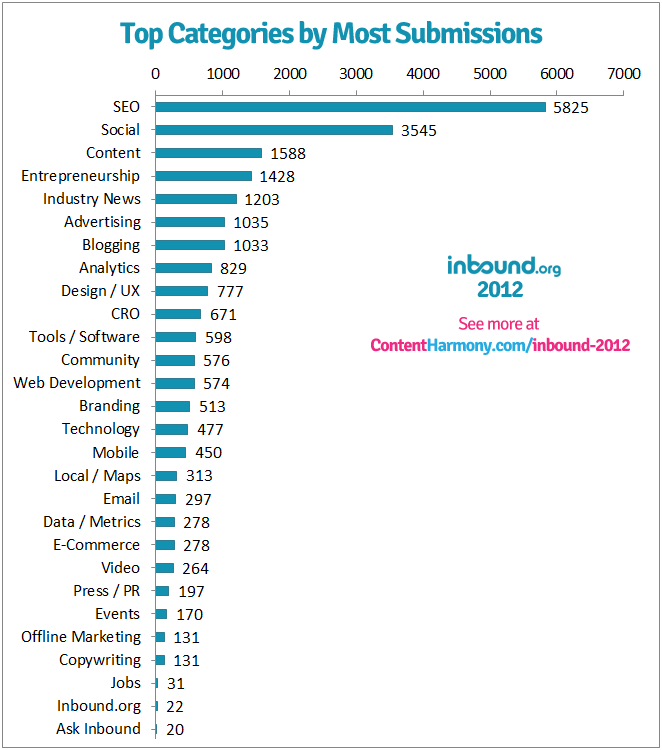
Top Categories by Total Submissions
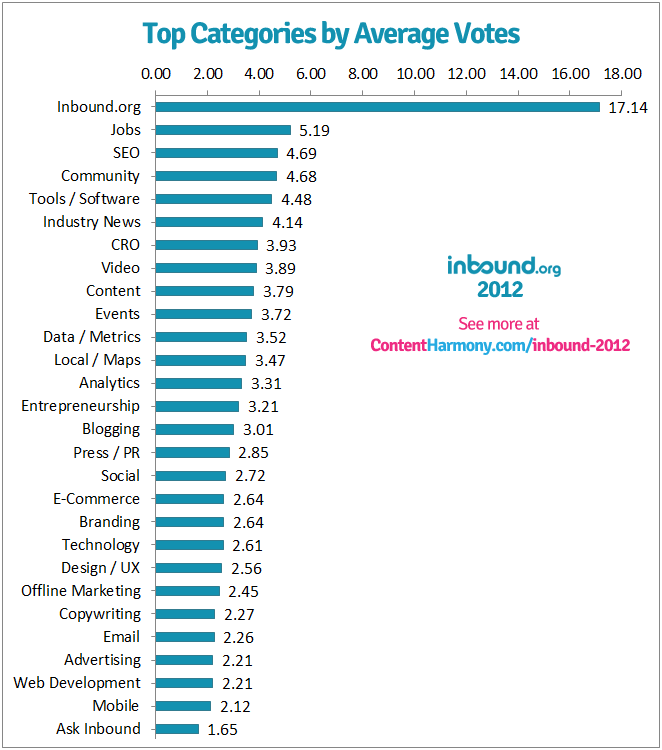
Top Categories by Average Upvotes
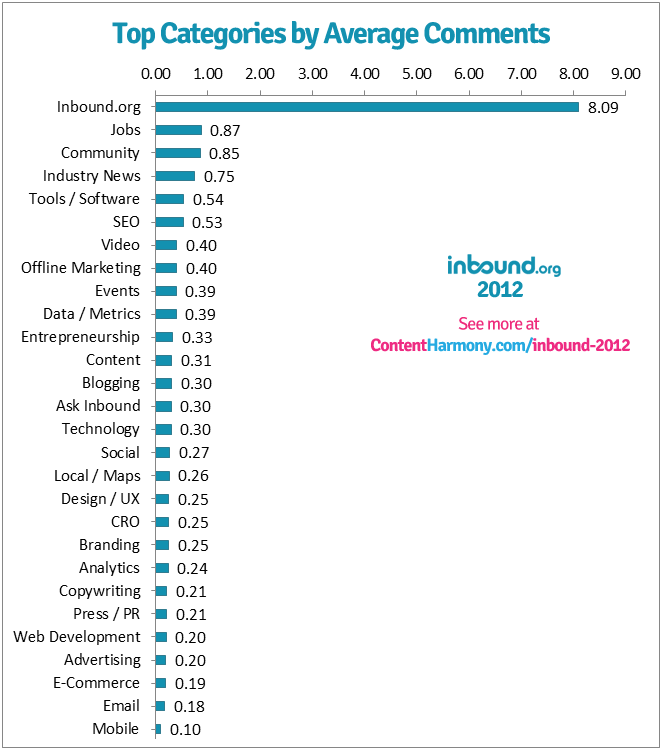
Top Categories by Average Comment Count
Trends
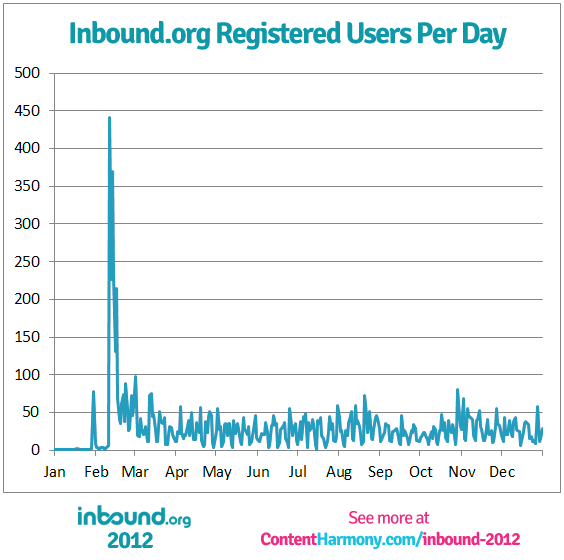
User Registration Velocity (by Day)
User Registration Velocity (Cumulative)
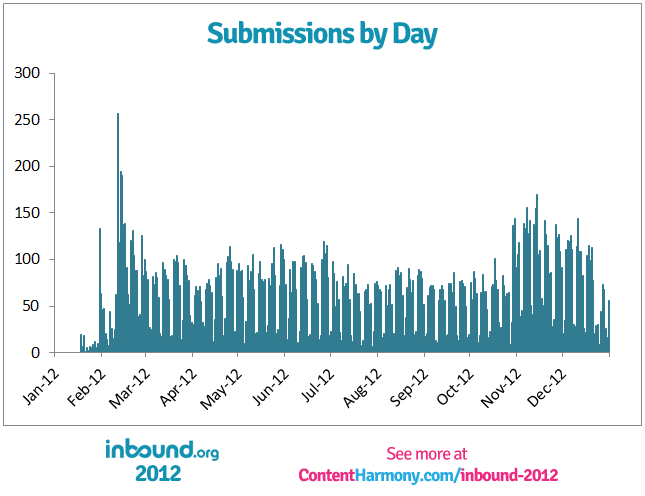
Submission Velocity
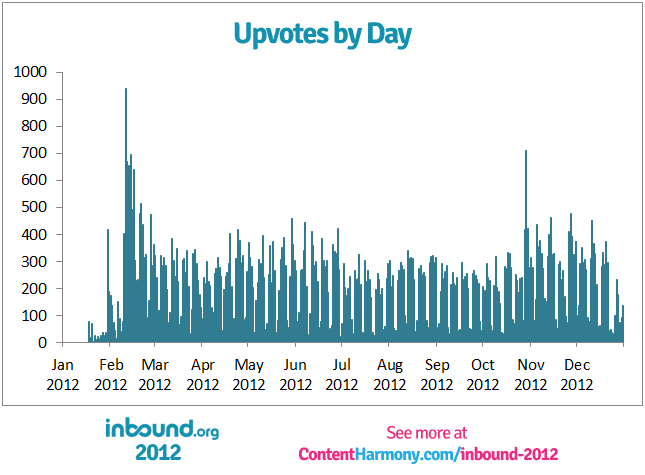
Upvote Velocity
I also graphed this chart by week because I thought it might be a bit more clear, however the data looked very similar to this version so I opted for the more granular view.
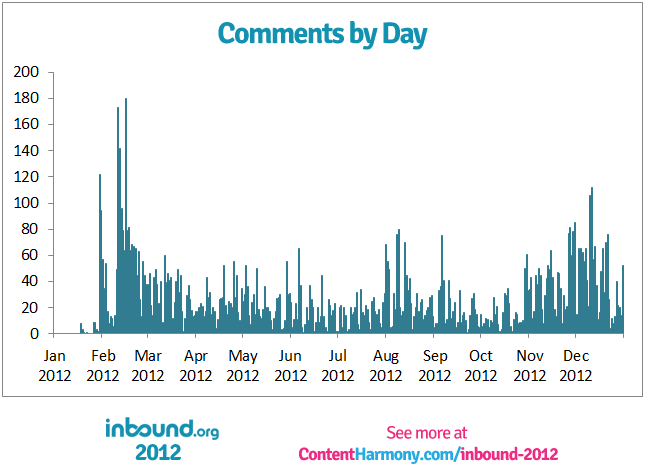
Comment Velocity
User Statistics
Top 25 Users by Highest Average Upvotes per Submission (filtered to users with more than 10 submissions):
Note from Kane: I decided that this was the only user-based chart that I’m going to generate. The top users by karma is easily available, and so are the most active users by frequency of submissions. But, I’d argue that this is the best metric of who’s contributing the most to the community. If the point of Inbound.org is to surface great content with less fluff, these are the people submitting the best content on a somewhat frequent basis, and not simply submitting content for the sake of votes.
| Rank | Name | Average Votes per Submission | Total Submissions |
|---|---|---|---|
| 1 | Sean Rvll | 21.29 | 17 |
| 2 | Mitchell Wright | 17.58 | 12 |
| 3 | Dana Loiz | 14.64 | 11 |
| 4 | Ryan McLaughlin | 13.65 | 17 |
| 5 | Richard Baxter | 13.46 | 13 |
| 6 | Martijn Scheijbeler | 11.96 | 23 |
| 7 | Brandon Hassler | 11.00 | 14 |
| 8 | Alaister Low | 10.90 | 10 |
| 9 | Patrick Hathaway | 10.58 | 24 |
| 10 | Adam Justice | 10.09 | 22 |
| 11 | David Cohen | 9.76 | 66 |
| 12 | Kevin Gibbons | 9.45 | 11 |
| 13 | Nick Eubanks | 9.41 | 27 |
| 14 | Steve Webb | 9.25 | 28 |
| 15 | Ross Hudgens | 8.56 | 36 |
| 16 | Anthony Pensabene | 8.27 | 112 |
| 17 | Rudi Bedy | 8.20 | 19 |
| 18 | James Agate | 8.00 | 13 |
| 19 | Wissam Dandan | 7.92 | 13 |
| 20 | Kieran Flanagan | 7.92 | 12 |
| 21 | Jon Cooper | 7.75 | 44 |
| 22 | Anthony D. Nelson | 7.53 | 47 |
| 23 | Chris Dyson | 7.48 | 164 |
| 24 | Hasson | 7.36 | 72 |
| 25 | Alistair Lattimore | 7.27 | 11 |
Time Statistics
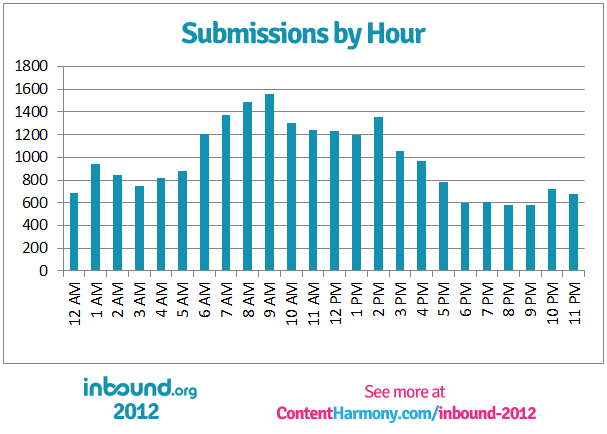
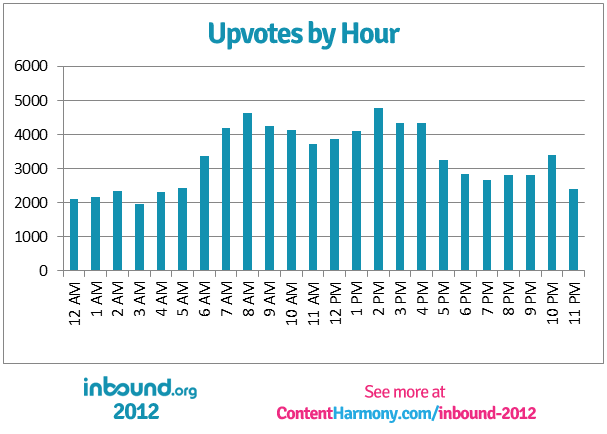
Submissions & Upvotes by Hour of the Day
I believe the following two charts are for the PST timezone (Seattle), but I’m checking with the inbound devs at the moment. I say that for two reasons:
- The original developer is from Seattle
- I think the increases correspond with the work day starting in the UK (GMT) at 1am PST, the East Coast (EST) at 6am PST, and then West Coast (PST) at 9am PST.
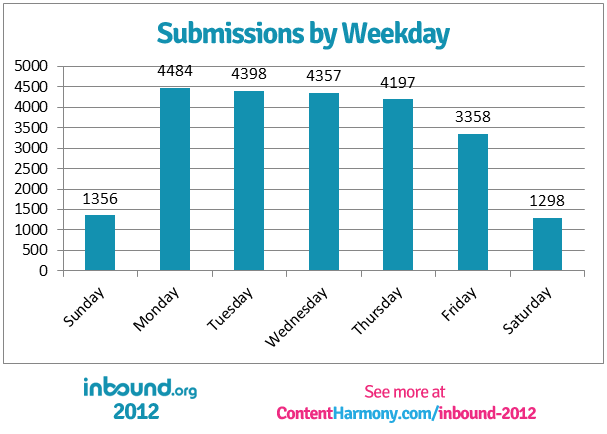
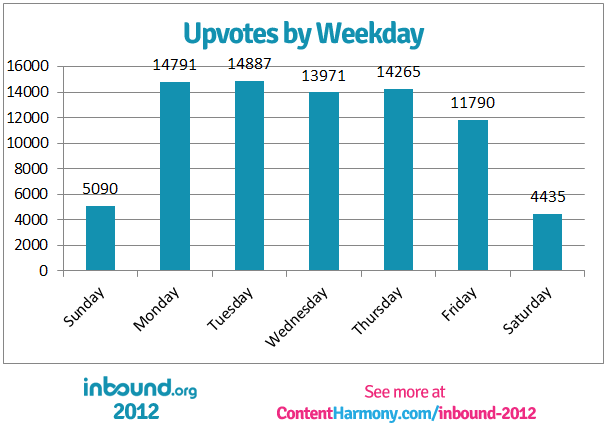
Submissions & Upvotes by Day of the Week
Content Statistics
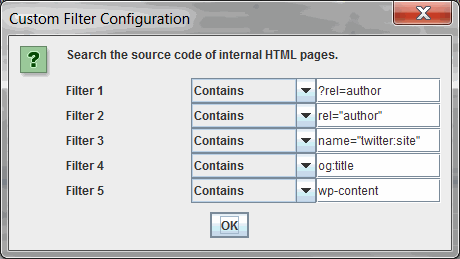
A total of 23,669 URLs on 5,640 subdomains were run through Screaming Frog. All of the usual fields were exported from Screaming Frog, and 5 custom parameters were added to the crawl as well:
- Filter 1 and 2 were to check for two types of Authorship markup.
- Filter 3 was to test for Twitter Cards.
- Filter 4 was to test for OpenGraph data.
- Filter 5 was to see how many sites were run on WordPress.
Crawl Results & Status Codes:
First off, even though I crawled 23,699 URLs, many of them were missing, redirected, or a number of other ridiculous status codes. I got some freaky exotic status codes. I mean really, 303 redirects? Shame on you NYTimes.com…
So here’s a quick rundown of status codes returned before we dig into the good stuff:
- -1 Invalid HTTP Response: 1
- 0 Connection Refused/DNS Lookup Failed: 173 (0.73% of URLs Crawled)
- 200 OK: 17,605 (74.28% of URLs Crawled)
- 301 Redirect: 4878 (20.58% of URLs Crawled)
- 302 Redirect: 478 (2.02% of URLs Crawled)
- 303 Redirect: 24
- 401 Authorization Required: 2
- 402 Payment Required: 3
- 403 Bad Behavior/Forbidden: 49
- 404 Not Found: 324 (1.37% of URLs Crawled)
- 410 Gone: 2
- 416 Requested Range Not Satisfiable: 1
- 429 Unknown: 4
- 500 Internal Server Error: 9
- 502 Bad Gateway: 6
- 503 Service Temporarily Unavailable: 32
I only used the 17,605 URLs that returned 200 status codes to calculate the following stats. Those 17,605 URLs came from 3,936 subdomains.
WWW vs. Naked Subdomain Usage:
Out of 3,936 subdomains:
- 2261 used a “www” subdomain (57.44% of subdomains)
- 1675 used no subdomain (naked) or a non-www subdomain (42.56% of subdomains)
- 231 used a “blog” subdomain (5.9% of subdomains)
Rel Author Usage:
Out of 17,605 URLs from 3,936 subdomains that returned a 200 status code:
URL Parameter: ?rel=author
- 2321 URLs utilized ?rel=author as a URL parameter
- 13.18% of URLs sampled
- 469 subdomains in total
- 11.9% of subdomains sampled
HTML Attribute:
- 10,801 URLs utilized rel=”author” as an HTML attribute
- 61.3% of URLs sampled
- 1657 subdomains in total
- 42.10% of subdomains sampled
2,126 subdomains had Authorship installed using one of the methods – 54% of the subdomains sampled.
Out of the 2,126 subdomains that had implemented Authorship, 77.9% of them used the HTML attribute method.
Twitter Cards Usage
Out of 17,605 URLs from 3,936 subdomains that returned a 200 status code:
- 4,553 URLs utilized name=”twitter:site” in the code, presumably in the Twitter card metadata
- 25.86% of URLs that were sampled
- 536 subdomains in total
- 13.62% of subdomains that were sampled
Note to self: I remembered after the fact that twitter:site is not one of the required Twitter card attributes. Nevertheless, I don’t feel like recrawling at the moment. Use twitter:card next year.
Facebook Open Graph Usage
Out of 17,605 URLs from 3,936 subdomains that returned a 200 status code:
- 10,867 URLs utilized og:title in the code, presumably in the Open Graph metadata
- 61.73% of URLs that were sampled
- 1,731 subdomains in total
- 43.98% of subdomains that were sampled
WordPress Usage
Out of 17,605 URLs from 3,936 subdomains that returned a 200 status code:
- 11,840 URLs had wp-content somewhere in the code, presumably due to the use of WordPress as a CMS
- 67.25% of subdomains that were sampled
- 2,432 subdomains in total
- 61.79% of subdomains that were sampled
And Finally, The Keyword Cloud:
I’ve read that ‘trying to find patterns in a word cloud is a bit like reading tea leaves at the bottom of a cup,’ but nevertheless, here it is:

✉️ Get an email when we publish new content:
Don't worry, we won't bug you with junk. Just great content marketing resources.
Ready To Try
Content Harmony?
Get your first 10 briefs for just $10
No trial limits or auto renewals. Just upgrade when you're ready.

You Might Also Like:
- The Wile E. Coyote Approach To Content Guidelines
- Content Brief Templates: 20 Free Downloads & Examples
- The Keyword Difficulty Myth
- How To Find Bottom of Funnel (BoFU) Keywords That Convert
- Bottom of Funnel Content: What Is BOFU Content & 10 Great Examples
- 20 Content Refresh Case Studies & Examples: How Updating Content Can Lead to a Tidal Wave of Traffic 🌊
- How to Create Editorial Guidelines [With 9+ Examples]
- Content Marketing Roles
- How To Write SEO-Focused Content Briefs
- The Content Optimization Framework: [Intent > Topic > UX]
- How To Update & Refresh Old Website Content (And Why)
- 12 Content Marketing KPIs Worth Tracking (And 3 That Aren't)
- 16 Best Content Writing Tools in 2024 (Free & Paid)
- How to Create a Content Marketing Strategy [+ Free Template]
- How To Create Content Marketing Proposals That Land The Best Clients
- What Is A Content Brief (And Why Is It Important)?
- How To Create A Dynamite Editorial Calendar [+ Free Spreadsheet Template]
- How to Use Content Marketing to Improve Customer Retention
- Types of Content Hubs: 5 Approaches & 30+ Examples
- How To Do A Content Marketing Quick Wins Analysis